SRP Track Record
Track Record details on all closed out Trades

2016, 2017, 2018, and 2019 YTD Track Record details are at the bottom of this page, scroll down to find the archives:
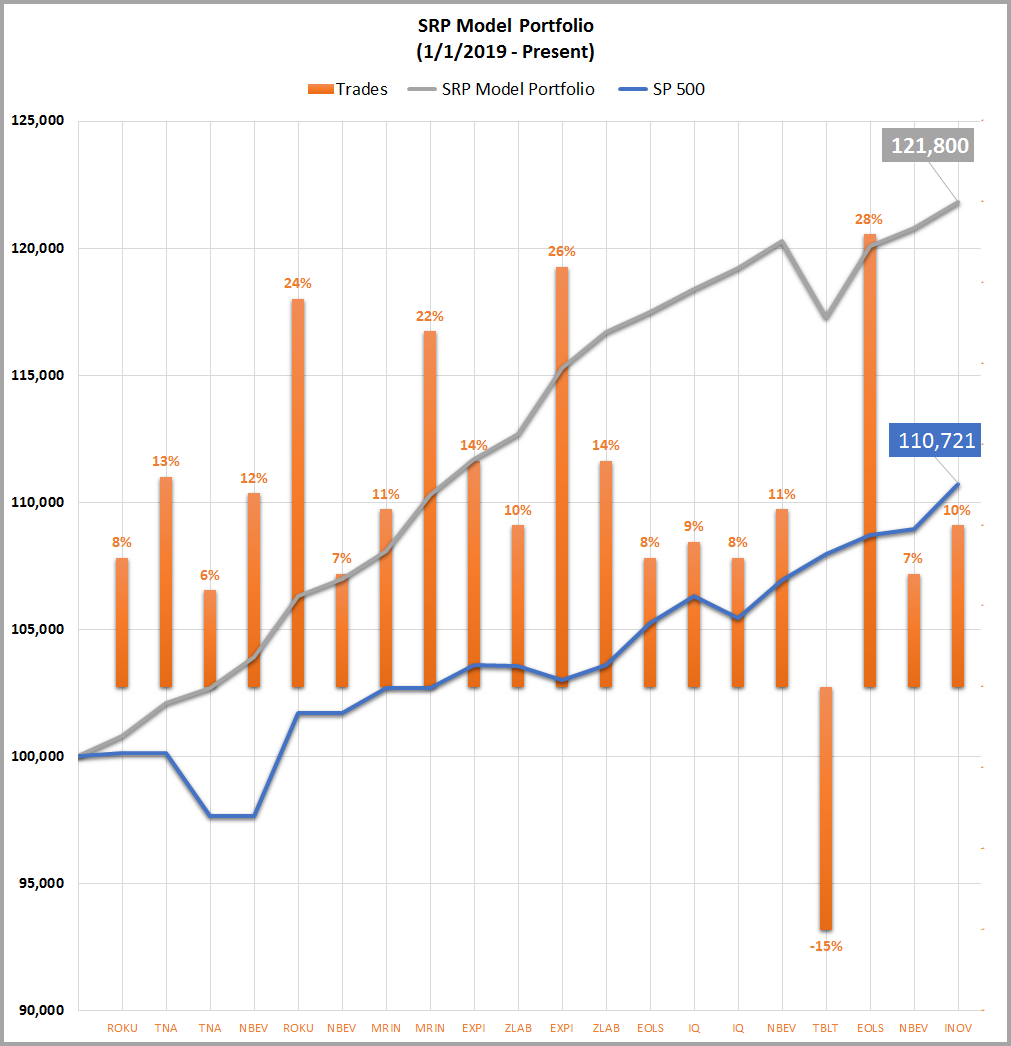
2019 YTD results 21% vs 11% SP 500 gain through 2/20/19
25 trade tranches closed out, 22 for profits in 2019 through 2/28/19
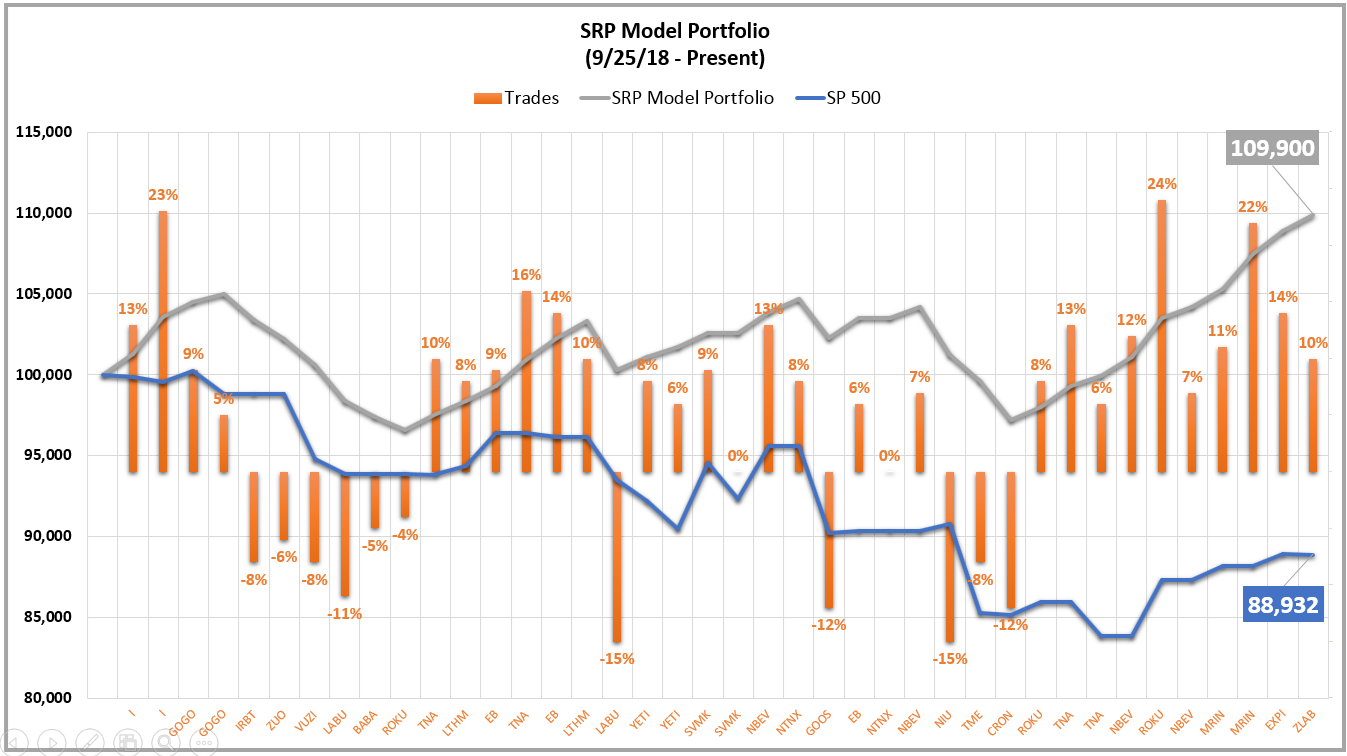
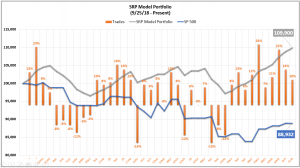
4th quarter 2018 results: 9.9% portfolio adjusted return vs -11% for SP 500
In a very difficult market where the SP 500 was down as much as 20% and Small Caps down 27%, we outperformed during the quarter. Our graph below outlines a relative portfolio value using 5 open trades at 20% each allocation as our typical weighting.
Click Chart to Enlarge
2019 Trade Results (YTD 2019 through 2/28/19) CLICK HERE
25 Closed Out Trades- 22 winners 3 losers for 90% Win Rate and market beating results
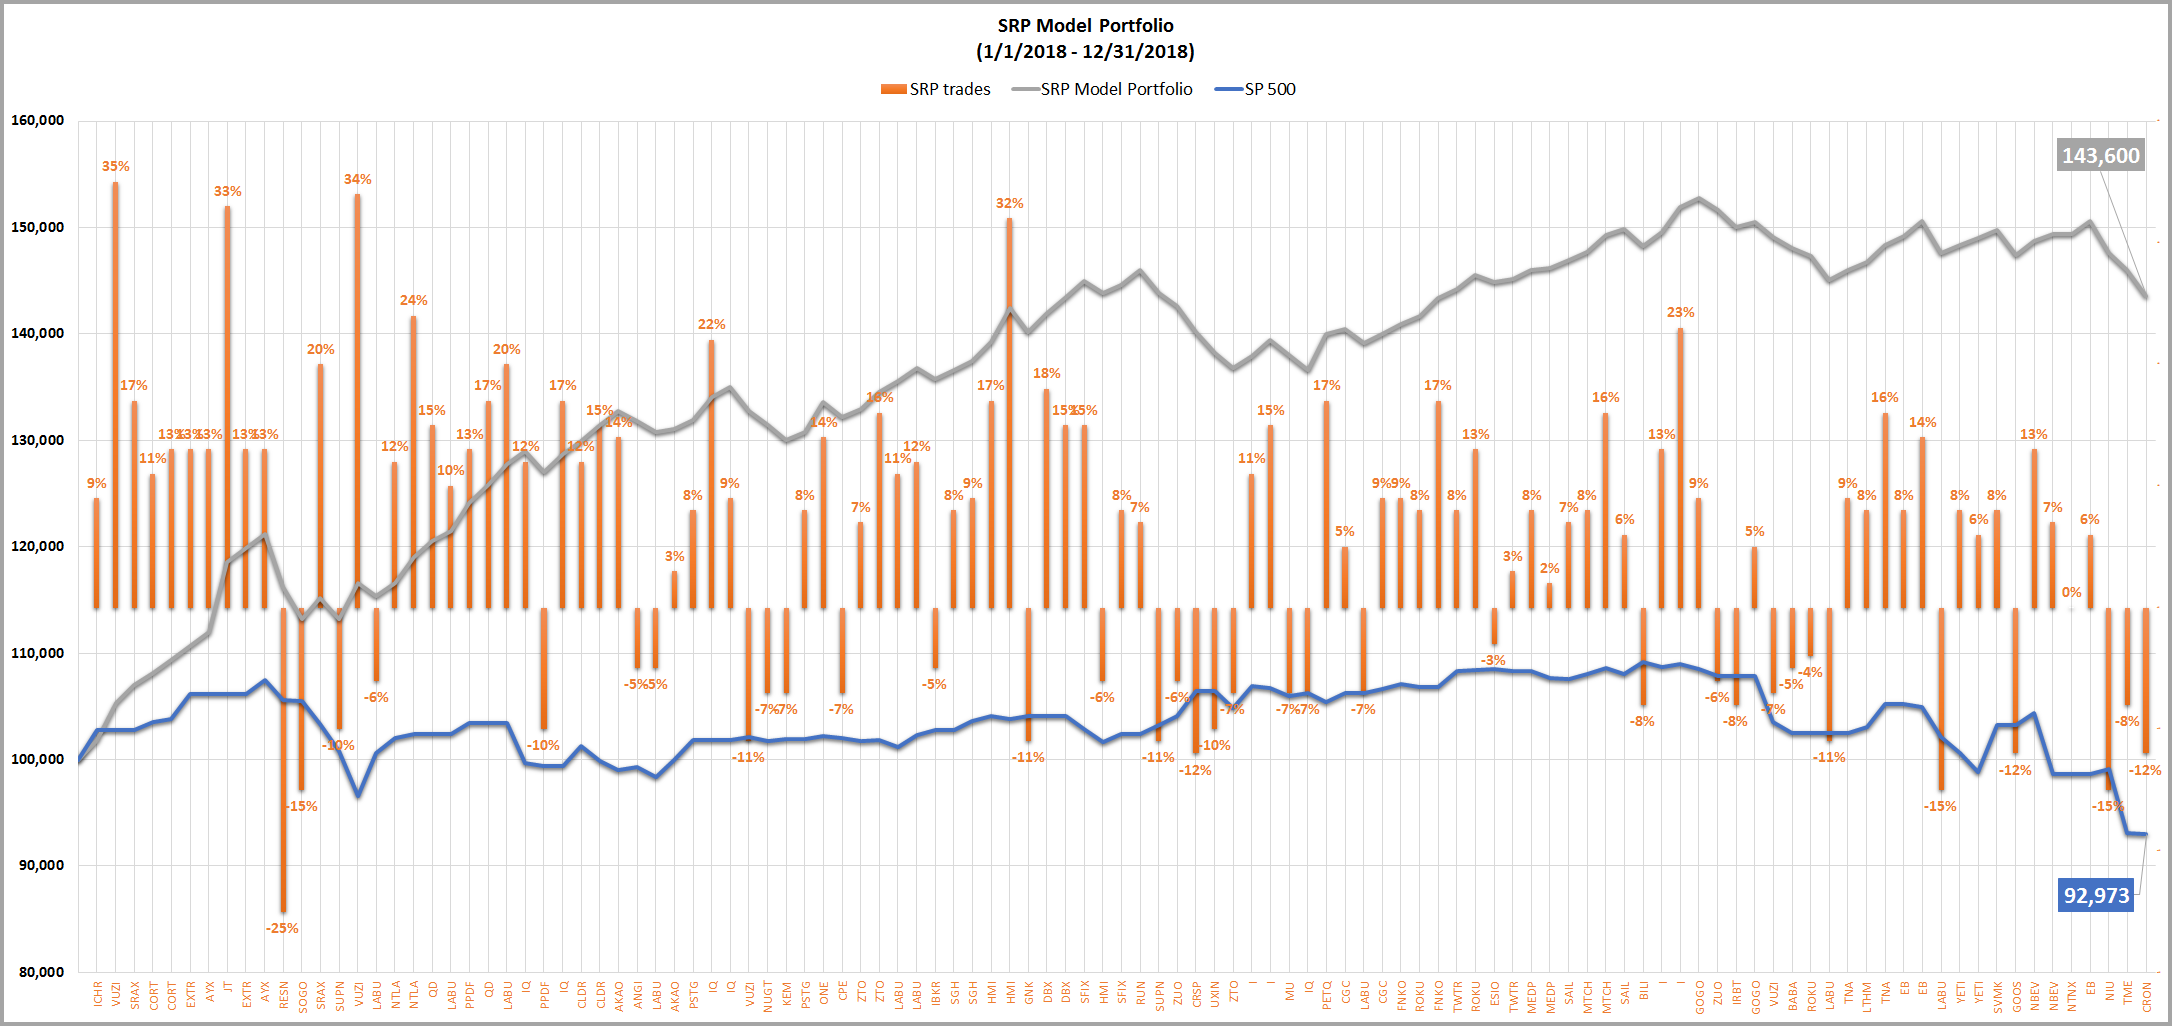
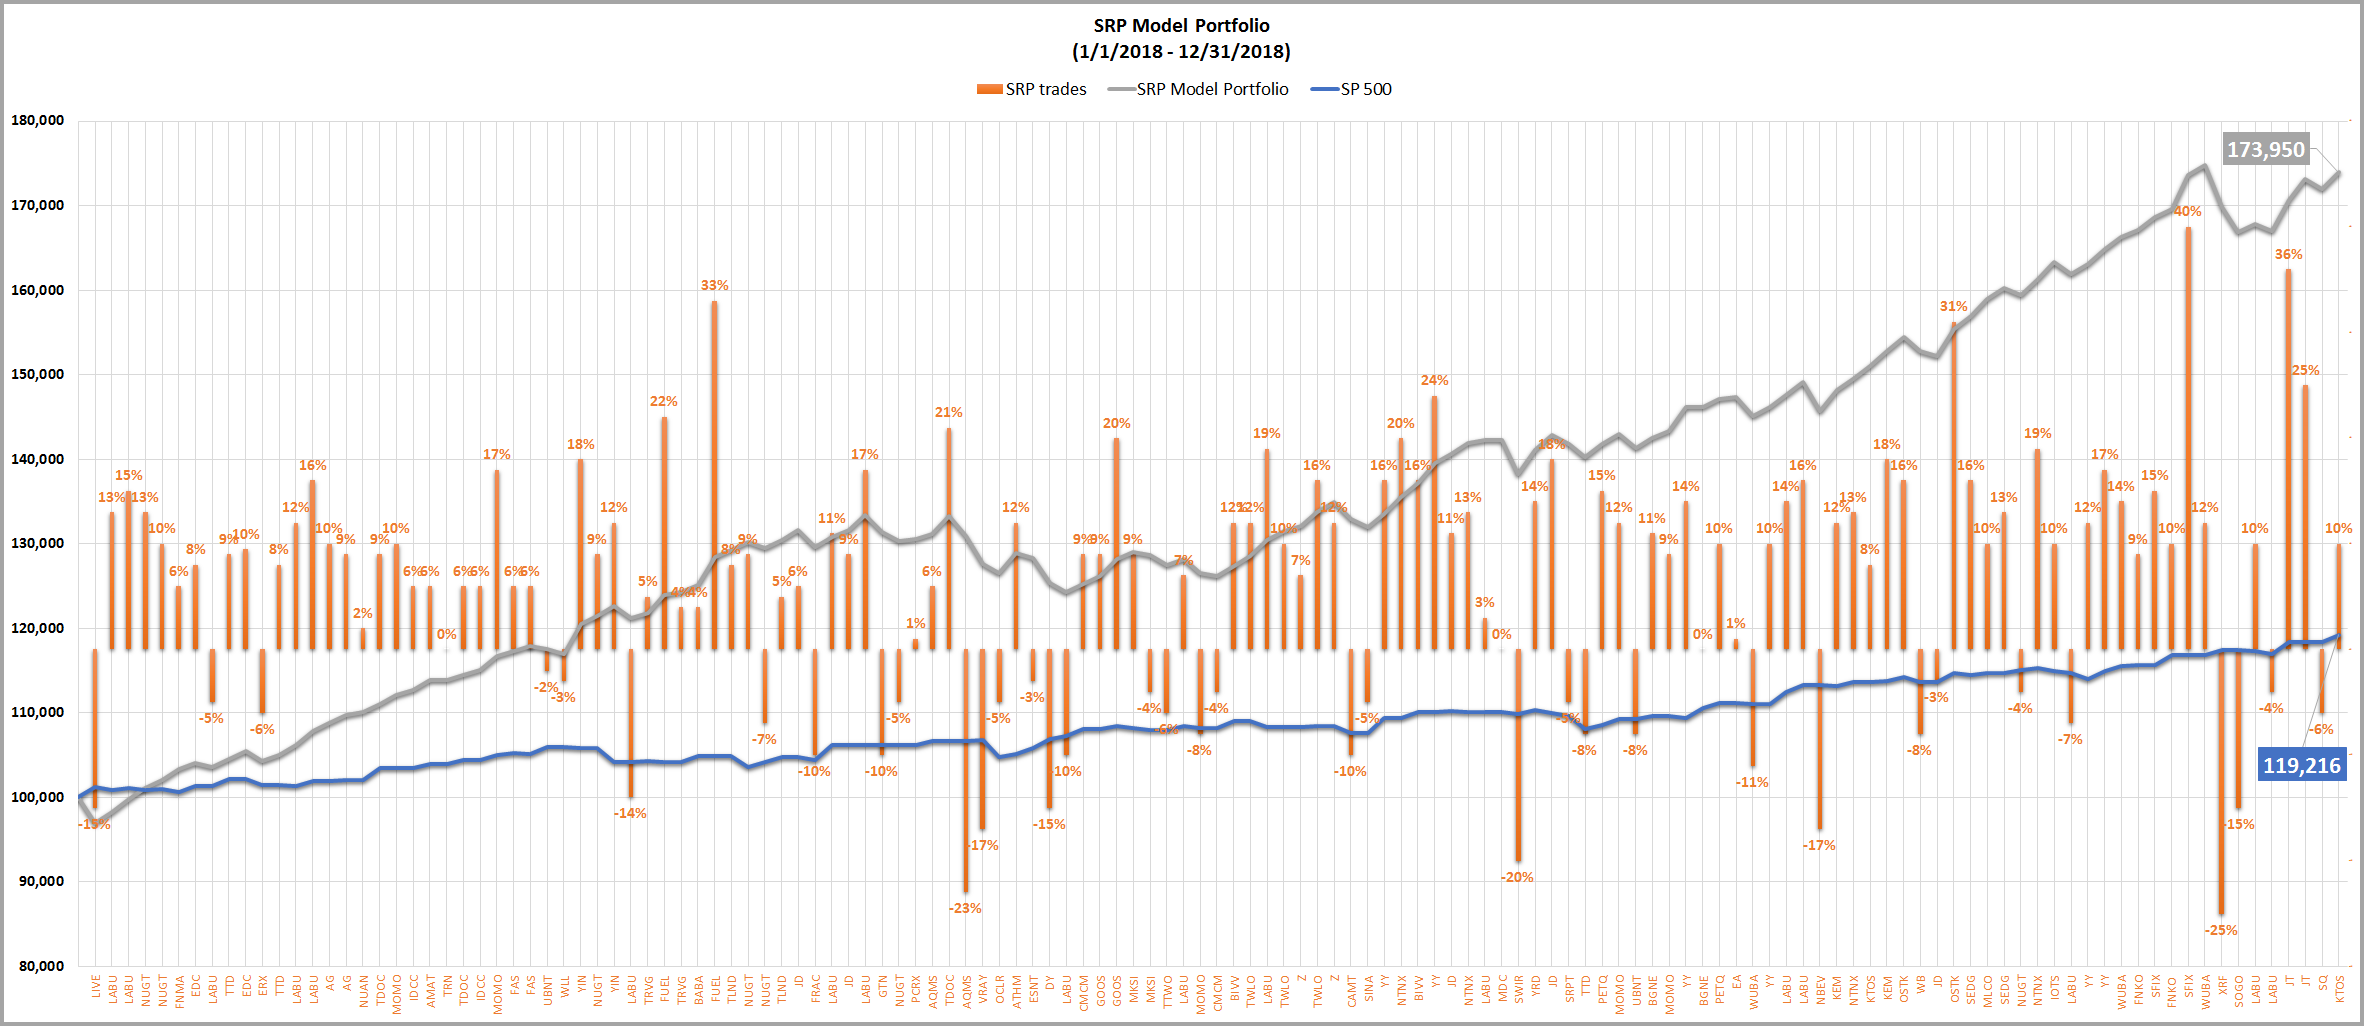
43% Portfolio Return vs -6% for SP 500 in 2018
102 Closed Out Trades- 68 winners 34 losers for 66% Win Rate and market beating results
138 Closed Out Trades- 104 Winners 34 Losers for a 75% Win Rate and market beating results
105 Closed Out Trades- 81 winning 24 Losers for a 77% Win Ratet and market beating results
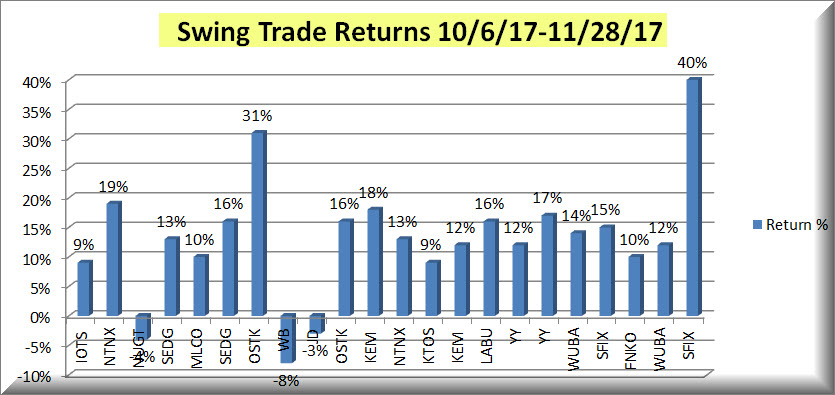
Sample Period: October 6 2017 to November 28th 2017 closed out trades
19 Winners and 3 Losers

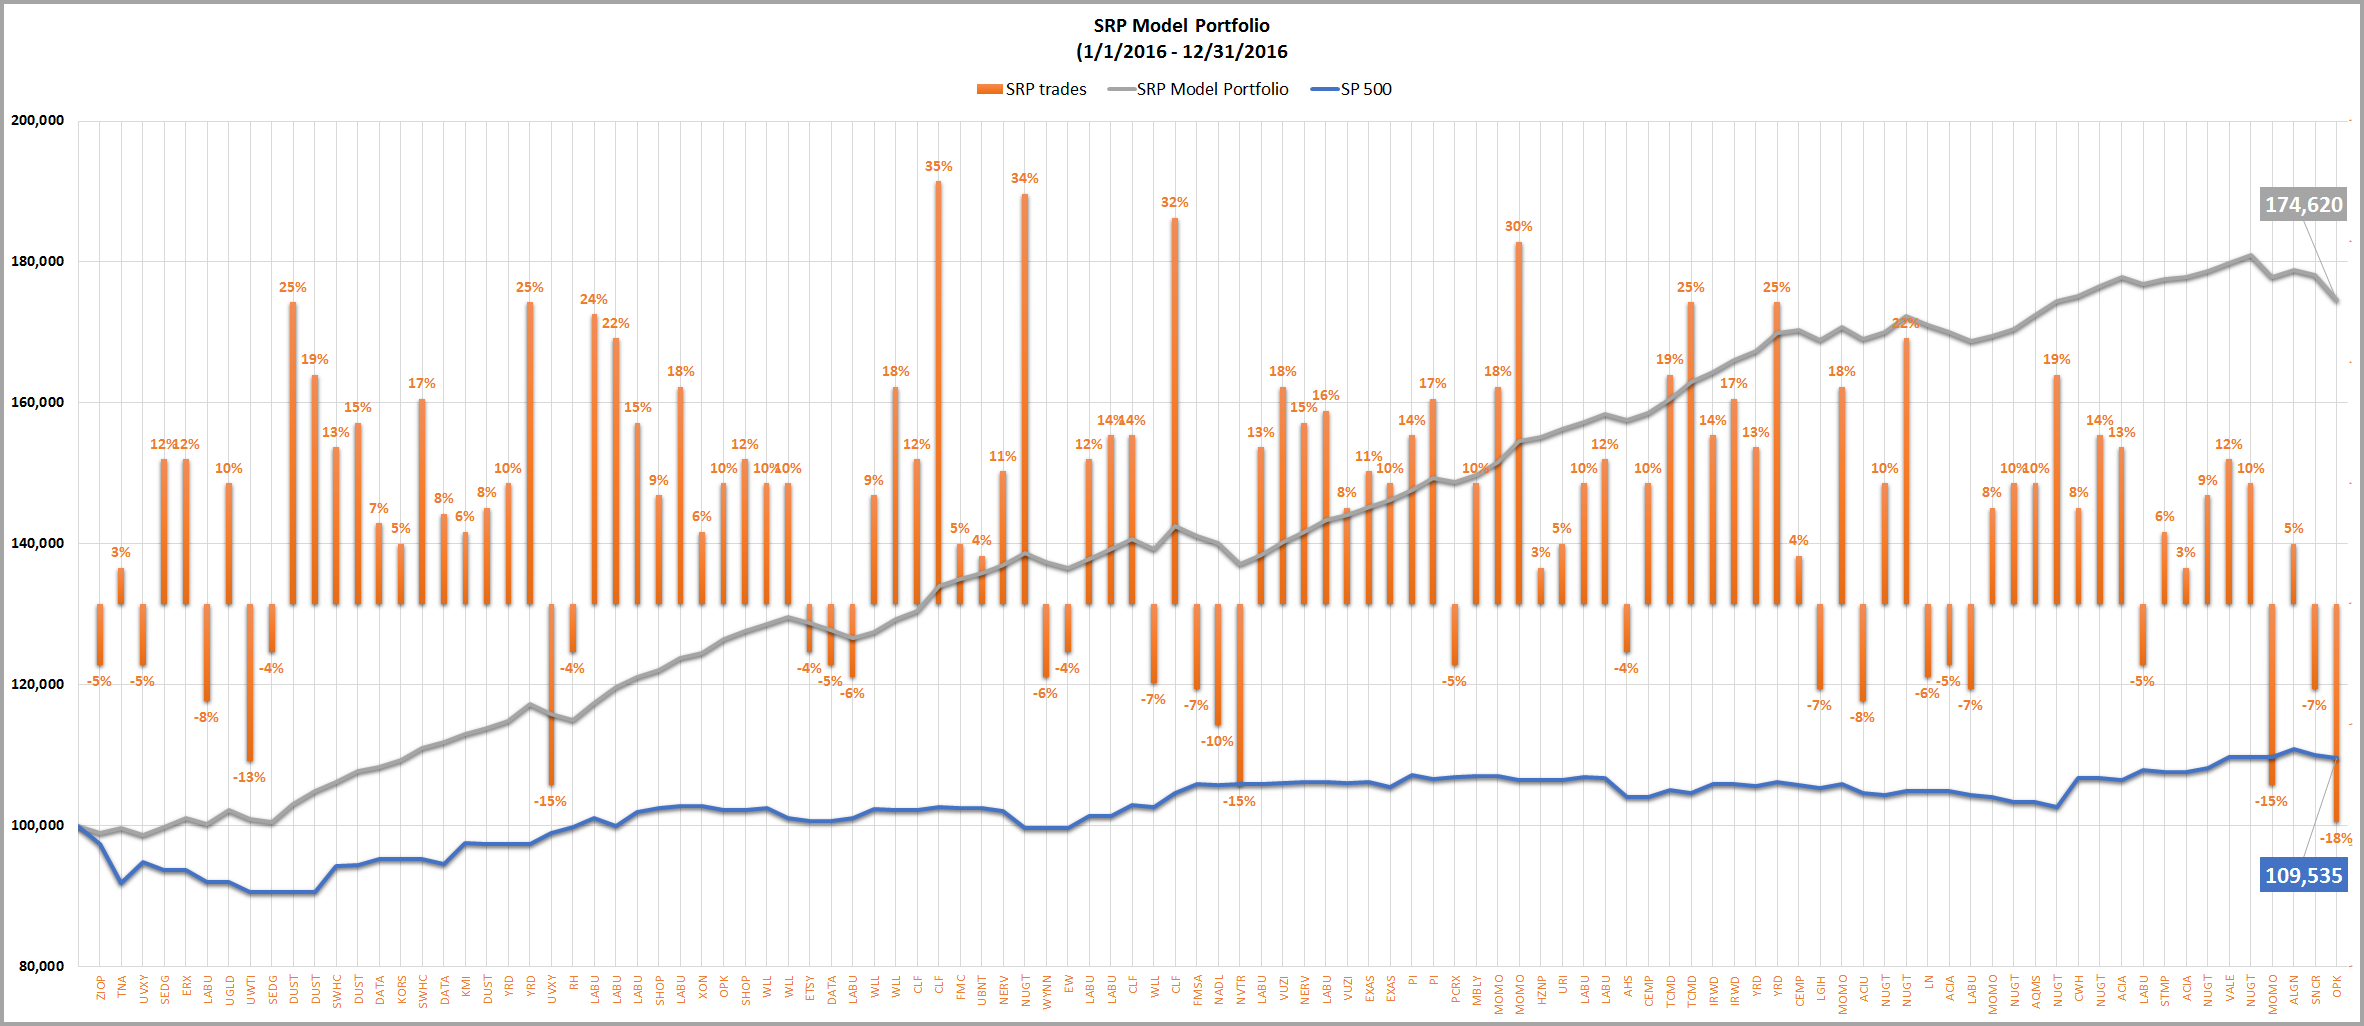
This page highlights 2016-2019 YTD Closed out swing trades at SRP. We have outperformed the SP 500 Index well over 12 to 1 since 9/1/13 inception:
Support@stockreversalspremium.com if any questions.
In 2019 through 2/28/19 we had 22 winning closed out Swing Trades and 3 Losers for over 90% success rate!
In 2018 we had 68 winning closed out Swing Trades and 34 Losers for a 66% success rate!
In 2017 we had 104 winning closed out Swing Trades and 34 Losers. A 75% Success rate!
In 2016 we had 81 winning closed out Swing Trades and 24 Losers. A 77% success rate which is nearly unprecedented.
We perform a thorough fundamental analysis on every stock we consider for a swing trade, and then if that passes our tests we then examine the technical patterns. The key to our success is maintaining this discipline in all market conditions. We also make sure to exit our positions without emotions involved, usually by selling 1/2 of the position on the way up and riding 1/2 a bit longer. We also set stops that are near the close of the market, and not intra-day which prevents us from needless losses due to normal volatility. The stops are strategically set based on behavioral patterns we apply to each trade, including 3x ETFs.
poshed at 18:14h
in
Track Record
Below we occasionally update our 2019 closed swing trades.
We often sell 1/2 at a time when we are up 8% or more on a swing trade, so we list every tranche below.
Chart through 2/15/19, Each trade listed at bottom through 2/28/19.
25 trades...
poshed at 18:59h
in
Track Record
2018 Trades
We often sell 1/2 of a position at a time as they move up in our favor. All of the trades below are based on average entry price and average sales price following an alert to buy or sell the position.
74 Winners 38 Losers...
poshed at 02:42h
in
Track Record
All 2017 Closed Trades, many our 1/2 size as we close 1/2 on the way up often.
This shows every trade we closed out via Alert with Text and Email to our Members in 2017. Our goal is to hit 70% of our trades for profits...
poshed at 15:39h
in
Track Record
Below are the Closed Trade tables from our 2016 quarterly Track Record posts which you can also view on this Track Record Page. The 1st quarter 2016 was rough and we still had 20 winners and 9 losers. The Bear cycle was ending then after...
poshed at 20:19h
in
Track Record
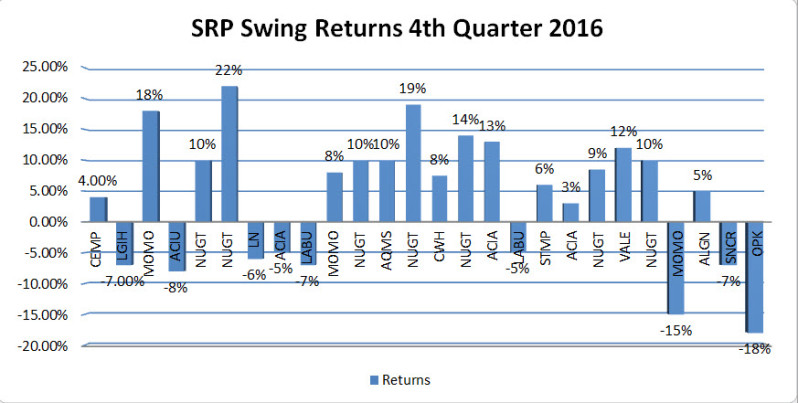
SRP 4th quarter 2016 Swing Returns Track Record
Below are the Full Details of our 4th quarter 2016 Swing Trade Track Record.
This is our entire list of closed out Swing Trades for the 4th quarter 2016.
We assume for math purposes that $20,000 is a sample size for...
poshed at 19:58h
in
Track Record
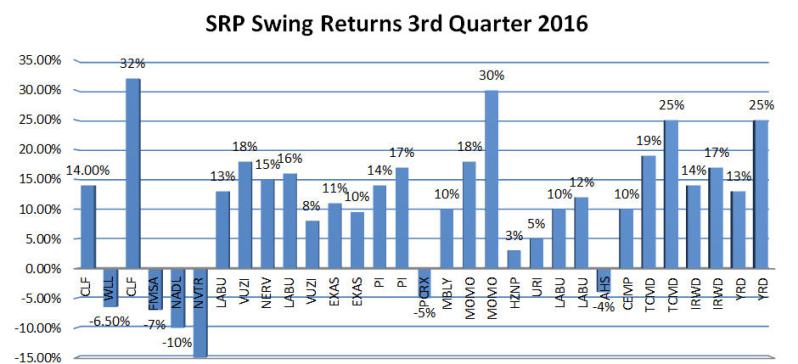
SRP 3rd quarter 2016 Swing Returns Track Record
Below are the Full Details of our 3rd quarter 2016 Swing Trade Track Record.
This is our entire list of closed out Swing Trades for the 3rd quarter 2016.
We assume for math purposes that $20,000 is a sample size for...
poshed at 20:22h
in
Track Record
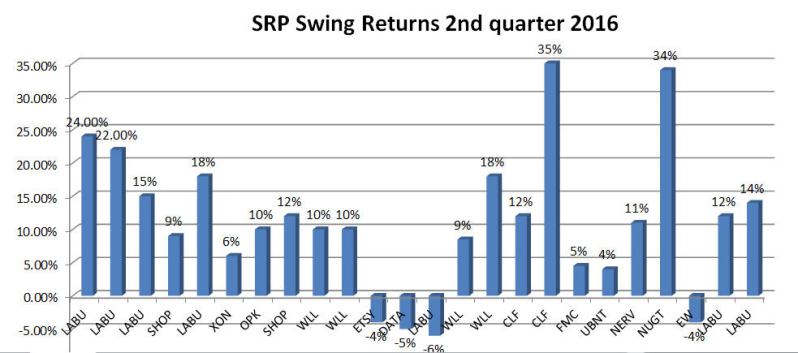
2nd Quarter 2016 Swing Returns
This is our entire list of closed out Swing Trades for the 2nd quarter 2016.
We assume for math purposes that $20,000 is a sample size for “Full Position” which we use as 10% of our model portfolio. A 1/2 position is 5%...
poshed at 20:24h
in
Track Record
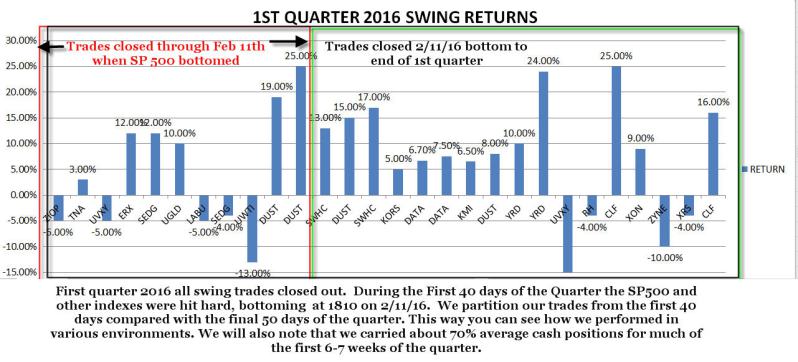
1st quarter 2016 Swing Returns
This page includes every closed out Swing Trade from the first quarter of 2016.
Many are aware the market was under extreme pressure from January 1st until February 11th 2016 when the SP 500 bottomed at 1810. The market managed to rally to...
poshed at 20:27h
in
Track Record
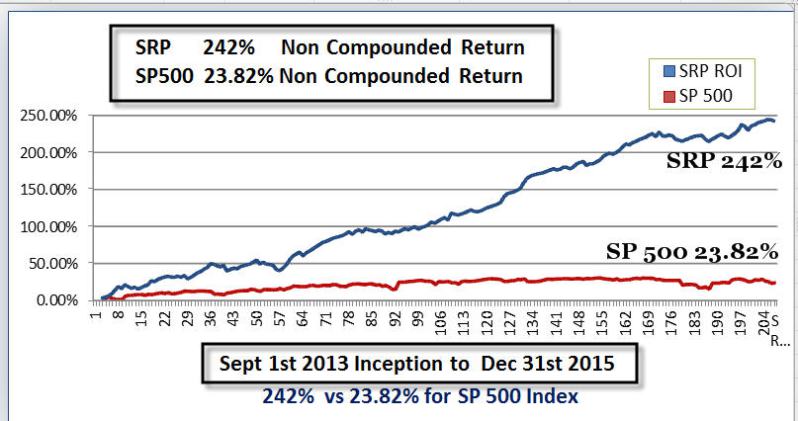
As of December 31st 2015 242% vs 23.82% for SP 500
This is based on 208 CLOSED Positions, open positions are not included until closed out.
We launched on September 1st 2013, we have beat the SP 500 over 10 to 1 since that inception date...