11 Mar Third Quarter 2016
Posted at 19:58h
in Track Record
SRP 3rd quarter 2016 Swing Returns Track Record
Below are the Full Details of our 3rd quarter 2016 Swing Trade Track Record.
This is our entire list of closed out Swing Trades for the 3rd quarter 2016.
We assume for math purposes that $20,000 is a sample size for “Full Position” which we use as 10% of our model portfolio. A 1/2 position is 5% or $10,000.
So if we closed out a trade for a 12% gain on 1/2 of a Full position, that would be $1,200 profit on $10,000 (1/2 of $20,000 full size assumed). You could use any $$ size you wish.
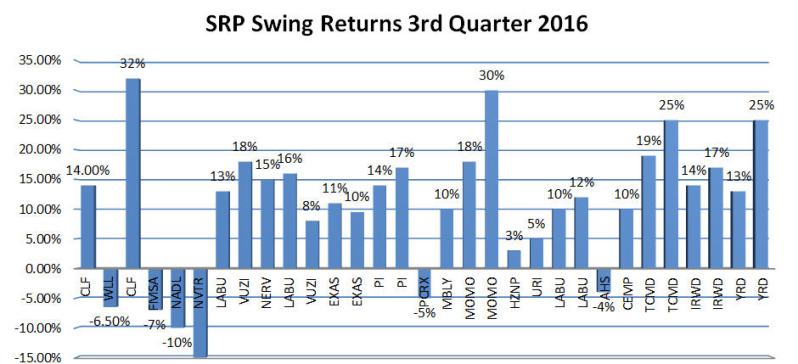
Below is our chart of all closed out trade gains and losses and below that is the full list:
We closed out 31 Trades in the 3rd quarter, 25 for profits and 6 were losers
| 3rd quarter 2016 | |||
| DATE | SIZE | SYMBOL | RETURN |
| 1-Jul | 0.50 | CLF | 14.00% |
| 7-Jul | 1.00 | WLL | -6.50% |
| 11-Jul | 0.50 | CLF | 32% |
| 14-Jul | 1.00 | FMSA | -7% |
| 15-Jul | 0.50 | NADL | -10% |
| 19-Jul | 1.00 | NVTR | -15% |
| 21-Jul | 0.50 | LABU | 13% |
| 25-Jul | 0.50 | VUZI | 18% |
| 26-Jul | 0.50 | NERV | 15% |
| 26-Jul | 0.50 | LABU | 16% |
| 27-Jul | 0.50 | VUZI | 8% |
| 1-Aug | 0.50 | EXAS | 11% |
| 2-Aug | 0.50 | EXAS | 10% |
| 15-Aug | 0.50 | PI | 14% |
| 16-Aug | 0.50 | PI | 17% |
| 19-Aug | 0.50 | PCRX | -5% |
| 23-Aug | 0.50 | MBLY | 10% |
| 23-Aug | 0.50 | MOMO | 18% |
| 24-Aug | 0.50 | MOMO | 30% |
| 24-Aug | 1.00 | HZNP | 3% |
| 24-Aug | 1.00 | URI | 5% |
| 7-Sep | 0.50 | LABU | 10% |
| 8-Sep | 0.50 | LABU | 12% |
| 14-Sep | 1.00 | AHS | -4% |
| 14-Sep | 0.50 | CEMP | 10% |
| 15-Sep | 0.50 | TCMD | 19% |
| 19-Sep | 0.50 | TCMD | 25% |
| 21-Sep | 0.50 | IRWD | 14% |
| 23-Sep | 0.50 | IRWD | 17% |
| 27-Sep | 0.50 | YRD | 13% |
| 28-Sep | 0.50 | YRD | 25% |


