25 May 15 Reasons We Went Bullish Last Week
May 25th 2016 Forecast Report- Editors Note, this was a Bullish Market call we made when everyone was bearish in Spring 2016.
We do Daily Pre-Market forecast updates on SP 500, Gold, Oil, Biotech and often other sectors as part of your SRP Membership.
There has been a lot of hand wringing regarding the US markets over the past many weeks, let alone since the start of the calendar year. Yet from our viewpoint, all of the evidence building up the last few weeks during this Wave 4 correction culminated this week…
This past week we began to finally see enough of our ephemeral indicators setting up conditions for a big rally and to new all time highs as we have been projecting for many weeks now.
Lets examine a few that we commented on late in the week both to our SR and SRP members:
- Goldman Sachs pounding the table Bearish the markets on Wednesday morning, since when does Goldman help out the retail investor? Always fade their calls… (Oil to $20, Gold to $1,000 etc)
- Jim Cramer on CNBC decidedly bearish this week in the morning shows. Jimmy always gets super bearish right at bottoms.
- Dennis Gartman starts the week very bearish on US Stocks. When is Dennis ever right at major pivots?
- George Soros and Carl Icahn with large US stock market short positions. Carl is wrong about 1/2 the time on his bets, not much better than a coin flip
- IPO’s at lows not seen since 2003 and 2009 (Both market bottoms)
- 5 day Put to Call ratio hit 1.37 this week, the highest reading in 5 years… wow
- Equity Funds have seen out flows in 13 of the last 16 weeks as investors pull 44 Billion out. Retail investors always bail at the bottoms and invest at the tops as a rule.
- Bond funds seeing massive inflows along with money market funds and Gold all year…scared money…
- Percentage of NYSE stocks over the 50 day MA line fell from 90% to 45% in last 5 weeks
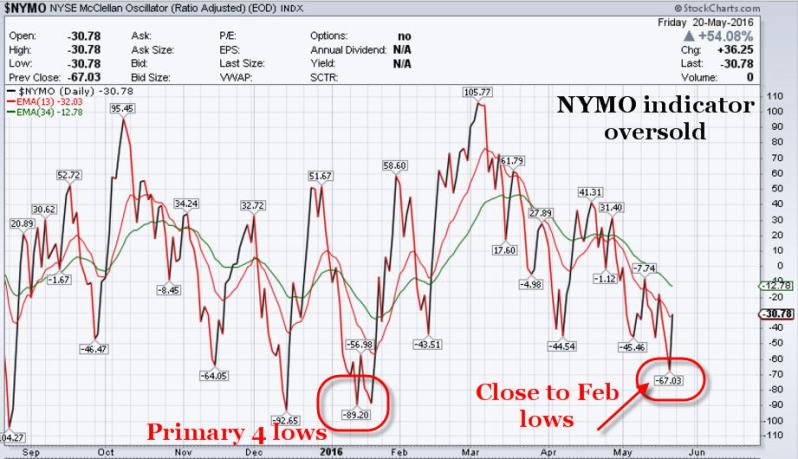
- NYMO oscillator neared the 2016 lows earlier this week
- AAII surveys on May 16th had only 20% Bulls, historically its near 40%
- Oil continues higher as we have projected ignoring bearish projections from the crowd
- Commodities (CRB) index remains in solid uptrend
- Chip stocks are rallying and turning up, a leading indicator
- The beat down Biotech and Pharma sector may be finally turning up
- US Dollar is likely peaking out on its rally in our opinion
- Wave 4 correction we projected would be 2014/17 or 2028 area, this week hit 2025 and rallied
- 5 week correction is about right after a 10 week rally
As if that were not enough, allow us to quote Investors Business Daily from the Weekend Paper:
“Investors should exercise caution in this market, it’s been choppy and difficult to trade”… “The stock market of 2016 is wearing investors out. Thursday, May 19, marked one year since the Dow Jones hit a new high. The SP 500 hasn’t made a new high since May 21, 2015… the market seems stuck in a rut and every time it looks like the bottom will fall out, it rises”
“If the market doesn’t scare you out, it will wear you out” -Wall Street Adage
As contrarian thinkers then, our bullish horns are growing amidst all this skepticism. Markets do not peak out when the preponderance of talking heads are negative and investors are rushing out of funds and into bonds. Markets dont peak with put to call ratios at 1.37 and individual investors decidedly bearish in surveys.
Instead, we complete a classic Wave 4 correction in zig zag fashions in the SP 500, Mid Caps, Small caps etc. While everyone worries about all that can go wrong, the market sets up for a Wave 5 rally to all time highs. Our projection of 2160 we came up with about two weeks ago once Wave 4 completed. It took 10 weeks for the SP 500 to rally over 3 waves from 1810 to 2111, we called the 2111 top on the nose weeks before it hit. We said to look for a wave 4 pullback of 23-38% in Fibonacci terms, and at 2025 this week we hit the 38% Fib on the nose and rallied 31 points.
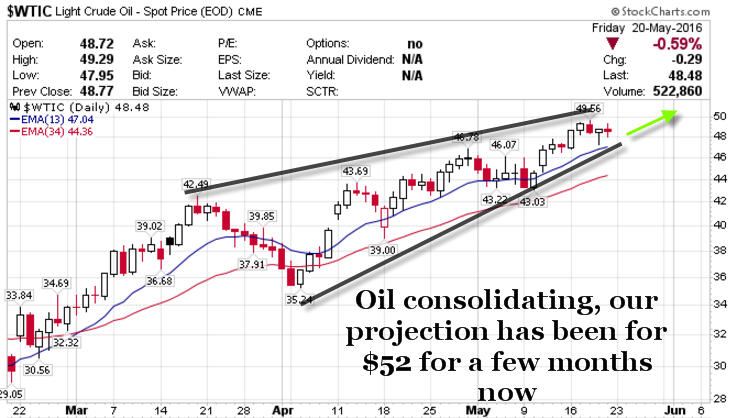
So if we take the evidence above, and add in that Oil continues towards our $52 target we laid out 5-6 weeks ago, Commodities remain in an uptrend, and the Dollar may be peaking in its recent rally soon… we have the foundations for a nice rally upwards.
There is not a ton of Alpha opportunities in a Wave 2 or Wave 4, its just how the market cycles work, but if you bail out near the end of those waves you WILL MISS the Alpha around the corner!
Lets look at a series of charts, they should be pretty self-explanatory:
SP 500: tags the 34 week MA line while also tagging the exact 38% Fibonacci re-tracement of Wave 3: Key to watch is 2014/17 as one more possible pullback low, but otherwise 2160 is the zone now.
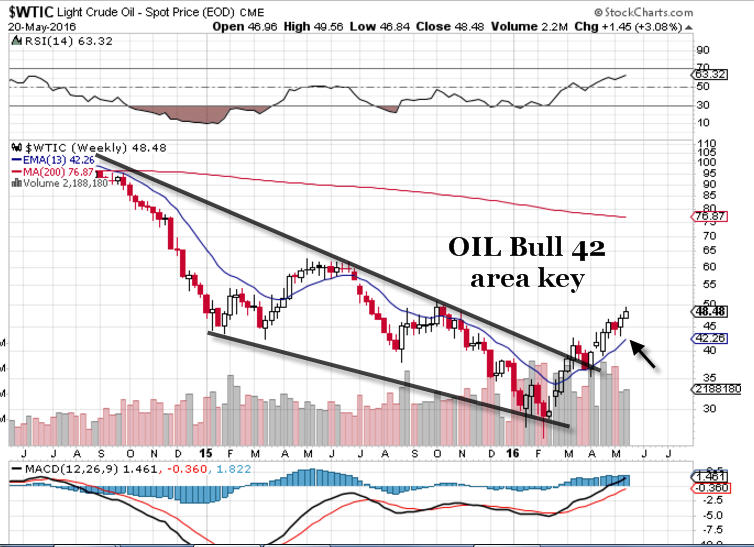
Oil continues to defy the bears: $52 has been our intermediate target for 6-7 weeks now, $64 is possible down the road
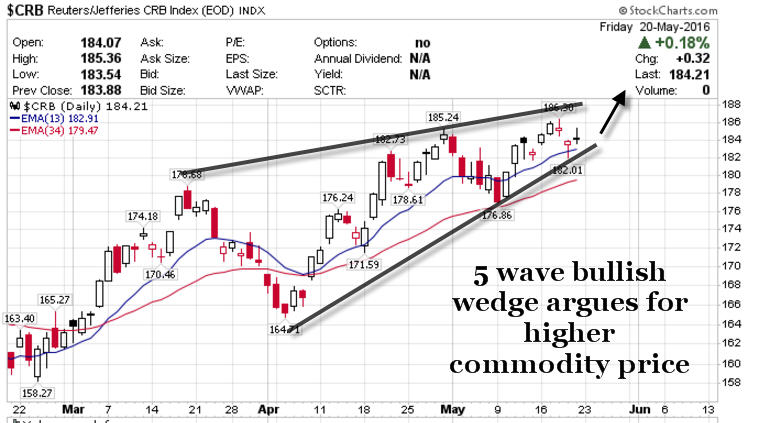
Commodities are consolidating as well nicely. Maybe its just a Bear Cycle rally, but its constructive:
A 5 wave bullish wedge is forming, most likely is a breakout. Is it time to re-enter those Reflation stocks we said two weeks ago were overdone and too much loved? If the wedge breaks on the downside, you’ll know… just watch that 180 area as key (184.21 now)
GOLD AND SILVER:
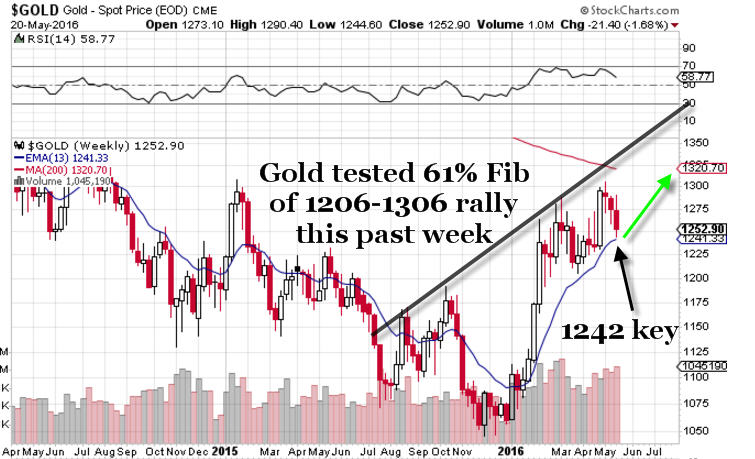
Everyone was piling into Gold at 1300 when we said it would top tick near the January 2015 highs of 1307. It hit 1306 and has been backing and filling. If it holds 1244 area it can re-attack 1300. If not, we may see 1206 again: Gold tested a 61% Fib retracement this past week then bounced.
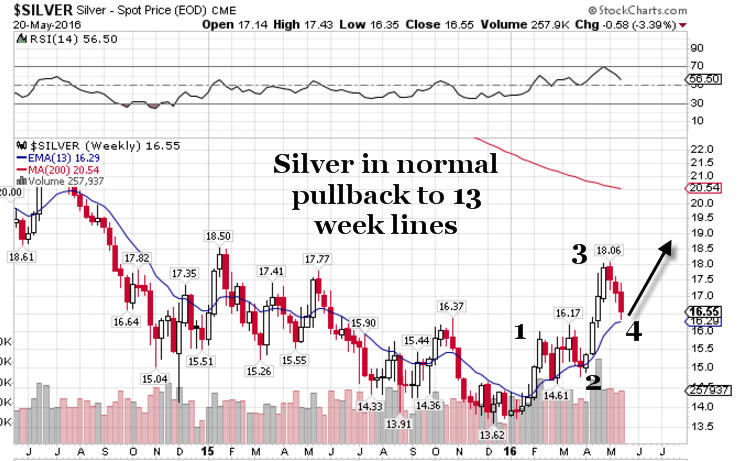
Silver chart also looks constructive as well at 16.20 support area
So we ask what is all the Bearish fuss about? Gold, Silver, Oil, CRB, SP 500 all look like normal consolidations to us. Unless price and form change, there is no reason to be a Bear yet.
However, we acknowledge that during the recent 4-5 week Wave 4 correction, that by definition people are supposed to be bearish near the end of it. Wave 2 and 4 in Elliott Wave theory are bearish sentiment patterns and crowd behavioral patterns. Wave 4 tends to be less harsh in terms of sentiment, but as we have pointed out this weekend and recently this past week in our morning reports, the evidence has mounted for Wave 4 to finish. We also had a turn window of May 20th we had notified our SRP members about in advance, and we ran higher on Friday. This turn window coincides with patterns that effect how people react positively or negatively to inputs from the universe. If they are moved to be more rational and in a positive frame of mind, you will see that now reflected in the markets.
Did you note the move up in Chip stocks late in the week? You should because they tend to be a leading indicator of inflation and better stock prices. We also noted Gilead rallied 13 points on Friday, another bellweather stock in the BioPharm sector that has been beat down.
Another of our indicators we use is when a higher than normal percentage of our SRP members seem cautious or concerned on the markets. When the number of Emails we get are bearish rise we get bullish. When the swing trades get a bit muddy and rallies do not stick and they reverse in a Wave 2 or Wave 4 pattern of the markets, people get nervous and lose patience.
If the market doesn’t scare you out, it will wear you out
Having been through multiple Wall Street cyclical rodeos since starting trading actively in 1991, this is all part and parcel of the course. We have seen enough evidence to see that the tide may soon turn for momentum and growth stocks and smoother sailing may be ahead, at least for a little while.
Important areas to watch for uptrend supports:
- SP 500- 2014/2017 pivot
- Oil- $42 for the long term support
- Gold – $1242-$1244 for intermediate support, if not then 1206 test
- Silver $15.50 lower end, $16.25 preferred support
- NASDAQ 4678 the ABC 38% Fib double bottom
In terms of swing trading, we understand the investor malaise and concerns. Many pops turn into drops within a day or two. Not a lot of breakouts are sticking during a Wave 4 correction, that is by definition. Traders get worn out, they give up and throw in the towel just as markets are bottoming and about to turn in their favor.
Here is a list of a few stocks that have good weekly chart profiles and fundamentals:
PAYC, SWHC, ALGN, PRAH, CRTO, CLLS, FDP, NTGR, BUFF, CTXS, BSFT
That’s just naming a few worth looking into. For the first time in weeks we are seeing more than we can shake a stick at.
Chins up and fins up…
Dave, Chief Strategist


